Article

5 Agile Metrics to Consider Tracking for Continuous Improvement

July 18, 2024

|

Emily May

As an agile leader, using metrics to pinpoint areas for improvement is essential, but the sheer number of expert-recommended metrics can be overwhelming, leaving many wondering where to start. 

This article explores the purpose of agile metrics, common tracking challenges, and a few popular agile metrics to get you started. 

What are Agile Metrics?

Agile metrics are a collection of measurements used to assess progress toward business goals for continuous improvement, a fundamental principle of the agile mindset. Organizations can leverage these metrics to make data-driven decisions that directly impact outcomes related to team culture, customer experience, and other value-driving areas. 

For example, leaders at a tech company may infer that value is being delivered slower than usual due to competing priorities. To paint an accurate picture, they would explore the data behind the assumption, such as the most recent lead time metrics, and compare them against previous lead times.

A quick search on Google or ChatGPT will populate several agile metrics from which to choose. We recommend that teams utilize the agile metrics that fit their current circumstances and objectives and adapt them over time as needed. 

The main benefits of tracking agile metrics are:

  • Achievement of business goals and objectives
  • Enhanced customer value delivery
  • Continuous improvement 
  • Stakeholder satisfaction
  • Data-driven decision making
  • Organizational alignment
  • Operational efficiency

Common Challenges in Tracking Agile Metrics

Agile teams experience some common challenges when tracking agile metrics. 

One tricky aspect of analyzing data is the ability to attribute meaning to a data set. Uncovering the ‘why’ requires a holistic perspective on what is happening within and outside an organization that could influence the results. Assigning the wrong cause to the effect creates a chain reaction requiring teams to invest more time into a new initiative that may be unnecessary.

Further exploring the importance of context, agile teams should carefully choose metrics that suit their unique needs. The agile metrics we track within the ICAgile team are unique to our strategy, goals, processes, frameworks, and products. It’s essential to weigh all factors when deciding on the right agile metrics for your team. Remember, as your organization adapts, what you measure will also change. 

Finally, another factor to consider is finding a balanced relationship with metrics. Overloading too many metrics onto your team can be overwhelming, and relying too heavily on one metric can lead to lackluster results in other critical areas of your organization. While speed and data reporting are essential, stakeholder happiness is the key to success. 

5 Agile Metrics to Consider Tracking for Continuous Improvement

graphic of 5 agile tracking metrics

While there isn’t a “best of” list for agile metrics, we’ve compiled five tried and true agile metrics that can offer a broad range of benefits to agile teams.

1. Team Morale

One of the most critical aspects of a successful agile team is creating an organizational culture where your team is supported and empowered. Measuring team morale helps leaders determine what is working well and address any issues that hinder progress before they spiral out of control. 

How to measure: Some common ways to measure team morale include collecting feedback in one-on-one meetings, encouraging open discussion in team meetings, and utilizing anonymous surveys to collect insights. 

When to measure: Insights on team morale should be collected regularly on a rolling basis to ensure a positive working environment for every employee. 

Pros & cons: There are no limits to the many benefits of collecting insights on team morale. From improved retention to innovation, all stakeholders benefit from this measurement. 

Due to the personal nature of employee feedback, it can take time for team members to feel comfortable sharing their honest opinions. Organizational leaders should focus on developing psychological safety within their teams to reinforce open dialogue. 

2. Sprint Burndown Chart

graphic of a sprint burndown chart

A sprint burndown chart displays all work included and remaining within a sprint. This visual representation helps agile teams keep track of their tasks to ensure they can complete their goals for the sprint. The idea is to maintain a steady burndown rate throughout the sprint so that work isn’t packed too tightly into a specific number of days within the sprint. 

How to measure: Don’t worry; you don’t need to manually track your sprint burndown metrics. Sprint tracking tools like Jira can create the chart at the click of a button, so long as your team's sprint information is updated. 

When to measure: Sprint burndown charts can be referenced on a rolling basis throughout each sprint and in agile ceremonies, such as standups and checkpoints, to ensure team members understand the percentage of remaining work. 

Pros & cons: The major pro of a sprint burndown chart is the immediate visibility and insights that your agile team can use to ensure they are on track to hit the outlined sprint goals while noting issues slowing the process down. 

Adhering to the sprint goals is key to delivering value to our customers, but an overemphasis on the sprint burndown chart can impede adaptability–as short-term changes are inevitable. 

3. Velocity

Agile teams use velocity to measure the work completed during a sprint. Velocity is a performance-based metric that empowers teams to deliver value efficiently and estimate future workloads. 

How to measure: First, you’ll want to calculate an average agile velocity for your team over several sprints. For example, as a content writer, I know the average number of articles I can write within a given timeframe, which helps estimate my workload for each sprint. Further, the real-time velocity can provide insight into recent and current circumstances, such as why I may have exceeded or fallen short of my average work within a sprint. 

When to measure: Measure velocity after a sprint is complete or calculate your team’s average velocity over several sprints. Refer to these metrics in sprint planning sessions or when planning new product or service updates to estimate workload. 

Pros & cons: Understanding velocity provides a predictable nature for what the team can take on for the current sprint and what needs to be added to the backlog.

While velocity is a critical metric in agile teams, balance is vital. Customer outcomes should always take precedence over team outputs.

4. Work in Progress (WIP) Limits

graphic of a work in progress board

Work in progress limits, or WIP limits, are the limitations agile leaders place on the number of tasks in motion within an agile team’s workflow. WIP limits are critical to stakeholder outcomes, preventing team members from overloading their to-do lists with projects, resulting in quality work and improved customer satisfaction. 

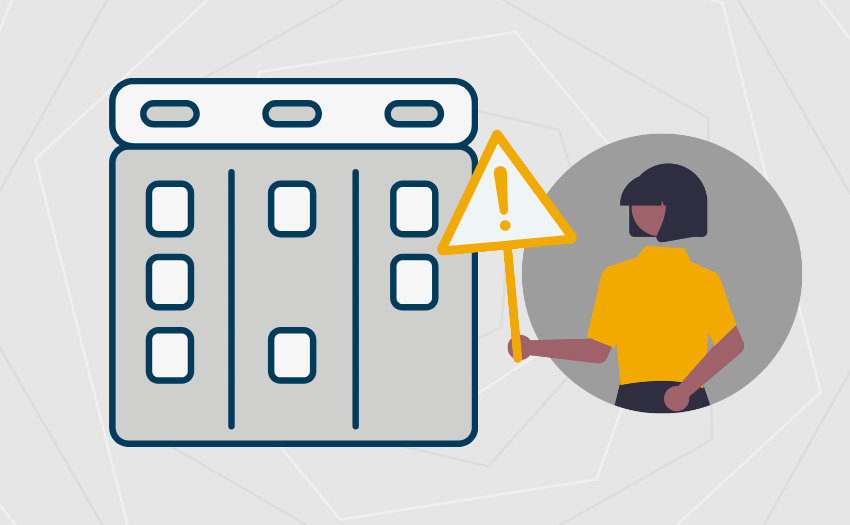
How to measure: Agile leaders should identify the stages of their agile team’s workflow. For example, the ICAgile kanban board has five columns: “to do,” “in progress,” “blocked,” “for review,” and “done.” Once the workflow stages are established, leaders can limit how many cards can be pulled into one column, such as only three cards at once in the in-progress column. 

When to measure: Team members should monitor WIP limits continuously and be encouraged to speak up if cards within columns exceed the agreed-upon guidelines. 

Pros & cons: WIP limits prevent multitasking so that agile teams can do their best work and prioritize customer-centricity.

Deciding on the correct work limitations for your team may be challenging and requires trial and error. Monitoring your team’s productivity and happiness week-to-week helps leaders gain a holistic view of the right work balance for the team. 

5. Cycle Time

Cycle time represents the time it takes to complete a task, from beginning to end. For example, once a card is moved to the “in progress” column on the kanban board, the cycle time starts, and when the card is moved to the “done” column, the cycle time ends. 

How to measure: Cycle time measures how long a project takes to complete and is typically represented in amount of days. Agile teams can manually track the number of days a project takes to complete, or some task-tracking programs have built-in cycle time metrics. 

When to measure: An agile team will want to revisit their cycle time metrics to improve their workflow. Another useful application of cycle time is analyzing the duration of new tasks, making it easier to estimate similar projects in the future. 

Pros & cons: Analyzing cycle time helps teams improve productivity, streamline their workflow, and identify bottlenecks. 

However, because cycle time is a short-term metric, it is important to maintain sight of the bigger picture and larger strategic goals. 

Conclusion

cartoon of people reviewing agile metrics

By choosing agile metrics that meet current circumstances, agile teams can make data-driven decisions that move them closer to achieving strategic goals and enhancing stakeholder satisfaction. 

Do you want to dive deeper into mastering the art of optimizing team efficiency and delivery management? Consider enrolling in our Agile Project and Delivery Management course today! 

We hope to see you in class soon!

Elevate Your Learning

Join our community of agile learners and get the latest news and resources delivered straight to your inbox.

* indicates required
TAGGED AS:
Value Delivery, Delivery Management, Agile Project and Delivery Management

About the author

Emily May | ICAgile, Marketing Specialist
Emily May is a Marketing Specialist at ICAgile, where she helps educate learners on their agile journey through content. With an eclectic background in communications supporting small business marketing efforts, she hopes to inspire readers to initiate more empathy, productivity, and creativity in the workplace for improved internal and external outcomes.